Four indicators on your facility, logged every week.
Beach width, freeboard, seepage staining and crest movement, read from imagery and written up as a dated log entry for each week.
- GSD
- VHR / ≤0.5 m
- Cadence
- Weekly
- Platform
- VHR satellite / aerial
- Thermal
- Yes
- Pond
- Beach width
- Freeboard
- Crest
- Downstream toe
What happens between walkdowns
You run a tailings storage facility, or you insure one, or you regulate one. The formal dam safety inspection and the engineer of record's review happen on their schedule, and the quarterly walkdown happens on yours.
Between them, the facility is watched by a technician on foot, by the instruments in the embankment, and by whoever notices something on the way past. Beach width, where the pond sits against the crest, a damp patch low on the downstream face, a line of movement along the crest: each one gets noted by eye, or written on a survey crew's list for when they get to it. Some of those changes build over weeks. The crew isn't careless. The walkdown simply hasn't come round yet.
So the change sits there. You find it at the next walkdown, or the engineer finds it at the review, and the first question in the room is how long it has been like that. The log can't answer, because the last look at that stretch of the facility was the previous visit. On a facility whose failure would be catastrophic, that gap in the record is the thing to fix.
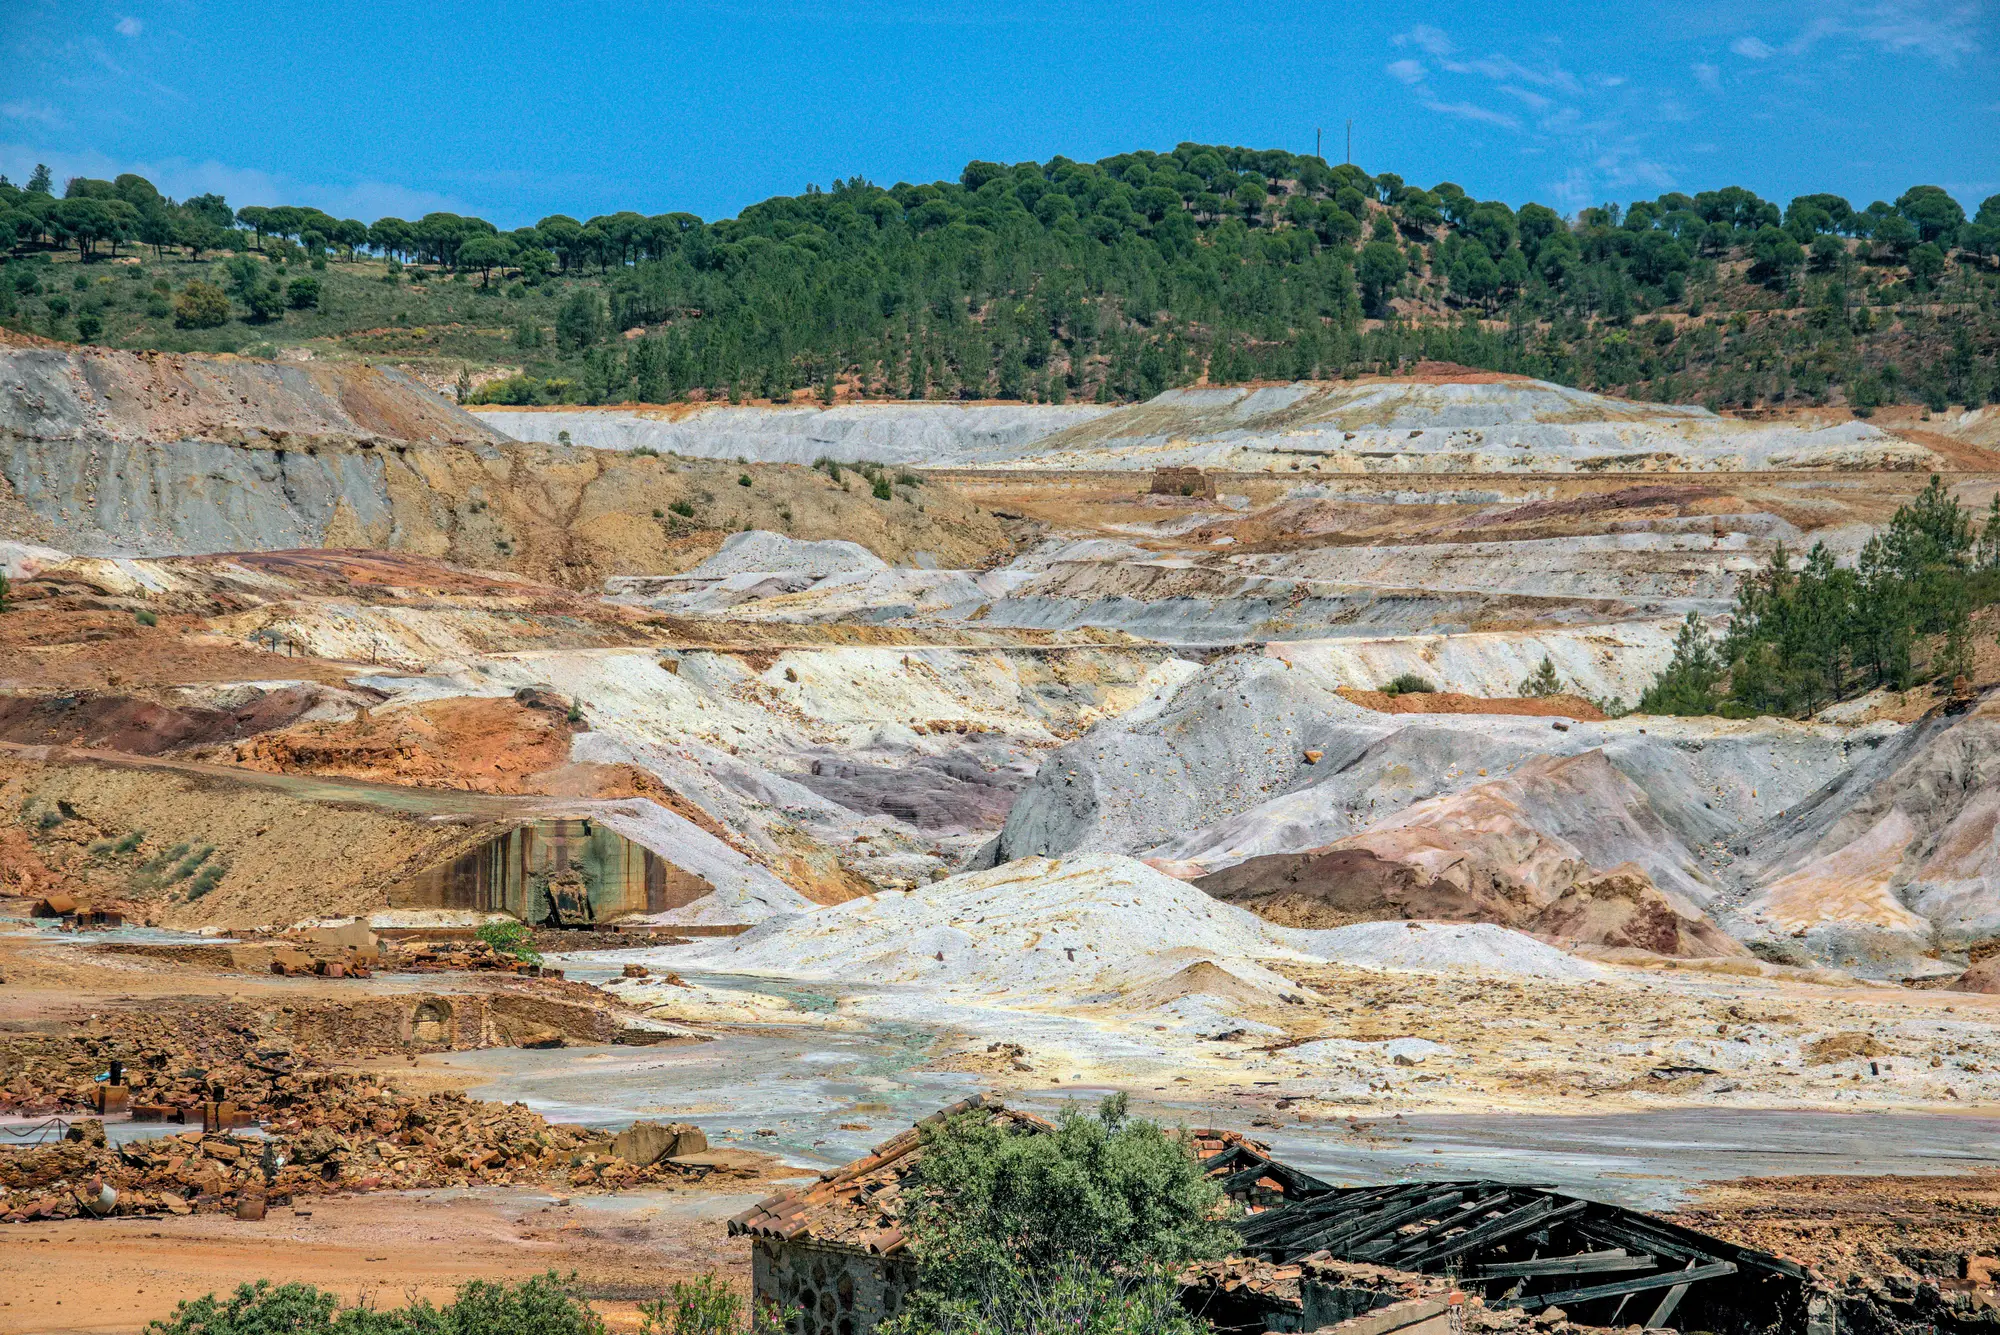
A weekly log entry doesn't decide anything about the dam. It gives the next walkdown and the next review a dated starting point.
This week's entry
The log entry is weekly, one per facility. Each indicator is measured against the baseline set for your facility, flagged if it crosses a threshold you agree on, and the source imagery comes with it.
Beach widthPer cell
Measured weekly for each cell you set up at the start, so a stretch where the beach is narrowing shows up in the entry and not only on the next walkdown.
Freeboard estimateAgainst baseline
The gap between the pond and the crest, tracked week to week against your reference. It comes as an estimate from imagery, and your survey data remains the record.
Seepage staining flagThermal plus RGB
Wet or discolored ground on the downstream face and toe, picked out from a thermal pass together with ordinary imagery. A flag means someone should go and look. It does not locate a leak.
Crest movementAgainst your baseline
Visible change along the crest since your baseline: slumps, scarps and cracks wide enough to show at this resolution. Creep too slow for imagery is the instrumentation's job.
Source imageryAttached
Every entry carries the images it was measured from, so your engineer can check any flag against the picture before deciding anything.
How it works
Set the baseline
You send the facility outline, how you divide it into cells and your own reference measurements. This is done once, with a person on our side, and it is what every later entry is compared to.
Weekly pass
Each week a very-high-resolution pass with a thermal capture covers the facility, from satellite or aerial platforms depending on what is available for your site. There is no drone launch.
Indicators measured
The four indicators are measured against your baseline, cell by cell.
The log entry
You get a dated entry for the week. If an indicator crosses a threshold, it is flagged in the entry. Thresholds are agreed with you at the start and stay yours to change.
Where it fits
The weekly entry sits between the quarterly walkdown and the engineer of record's review. Bring it to the walkdown to tell the technician where to look first. Bring it to the review as a record of what the facility looked like week by week. The decision stays with the people who carry the responsibility.
Limits
Support for monitoring, not a safety opinion
This does not certify a dam, sign anything off or replace the engineer of record's inspection. It gives that inspection more to work with.
Weekly is not continuous
A fast-developing event can start and finish between two passes. A weekly log narrows the gap between walkdowns. It doesn't close it.
Cloud can delay a pass
Optical imagery needs a clear view. A cloudy week can push a pass back, and the entry says when the imagery was actually taken.
Surface indicators only
Imagery reads the surface. Pore pressure, internal erosion and what is happening inside the embankment stay with your instruments and your engineer.
Resolution sets the floor
At half a meter a pixel, a feature has to span several pixels to show. Hairline cracks and slow settlement are below that, and crest movement here means change large enough to see.
Freeboard is an estimate
A vertical gap read from imagery is less certain than a survey shot. Use it as a weekly trend, and keep the surveyed value as the record.
Thermal flags need ground checks
A warm or cool patch can have several causes. Every seepage flag needs someone on the ground before it means anything.
Who it's for
- Tailings or geotechnical managers who want a weekly record between walkdowns and formal inspections.
- Engineers of record and surveillance teams who want a dated starting point for each review.
- Insurers and regulators who oversee a facility and want a regular view of the same four indicators.
Who it's not for
- Anyone looking for a certified dam safety assessment or a compliance sign-off.
- Teams that want a failure prediction or a guaranteed warning time. This reports what was observed.
- Replacing piezometers, inclinometers, survey monuments or radar. Those measure things imagery can't.
- Structures with no tailings, such as water-supply dams.
Questions from engineers and insurers
Does this replace the engineer of record's inspection?
No. It gives the engineer a weekly record to read alongside the walkdown and the formal inspection, and the judgment stays theirs.
Can it catch a fast-developing failure?
Not reliably. A weekly pass can miss an event that starts and finishes between visits. No warning time is promised.
What about cloud cover?
A cloudy week can delay the pass. The entry states the imagery date, and a missed week shows as a missed week.
Does a seepage flag mean a confirmed leak?
No. It marks a thermal and visual pattern worth a look on the ground. Someone has to go and verify it.
Does it see inside the embankment?
No. Imagery reads the surface. Internal conditions come from your instruments and your engineer.
How do we check it against our own survey data?
Each entry attaches its imagery and dates, so your survey crew's freeboard shots and your technician's walkdown notes can be laid beside it. Tell us where your reference data lives when the baseline is set.
Can we see the thresholds and change them?
Thresholds are set with you at the start against your own baseline, and you can ask for them to be changed.
Who owns the imagery and the log?
Ownership and use terms for the delivered entries and imagery go into the contract before work starts. Commercial imagery providers keep their own licences.
How is it priced?
Each facility is scoped and quoted on its own: the number of cells, the platform that covers the site and how long you want the weekly log to run. You get a written scope you can take through procurement.
Add your facility to the weekly log.
Or .