Blog·
Field notes: the week the decant pond crept three metres and nobody logged it
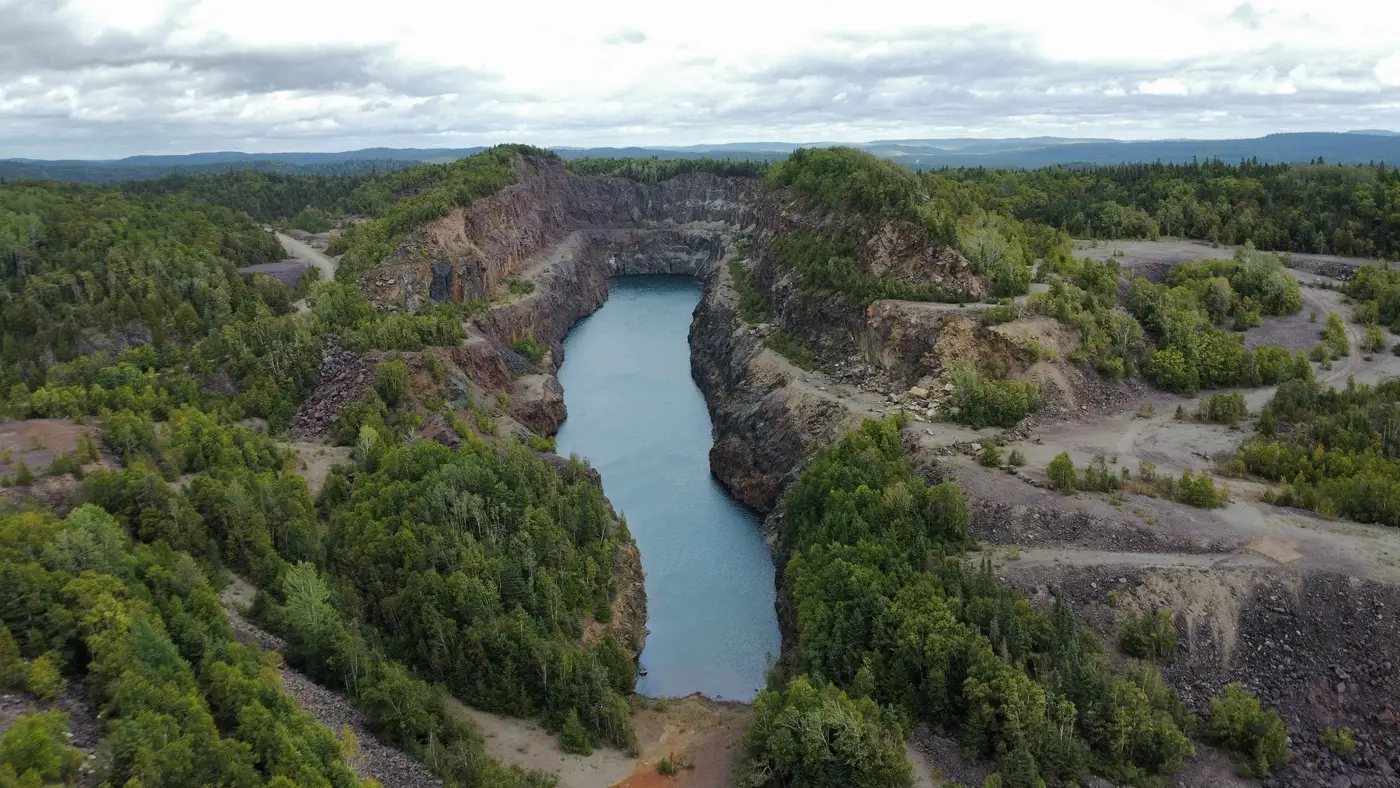
There's a particular kind of entry that shows up in old walkdown logs, if you go back far enough. Not an alarm. Not even a flag, usually. Just a dimension that's quietly different from the one before it, sitting in a column next to three other dimensions that look fine.
Decant pond offset from toe: 34 m. Then, eleven weeks later: 31 m.
Nobody wrote anything in the remarks field either time. Why would they? A three-metre shift in a pond edge, against a baseline nobody had drawn a line on, isn't a number that jumps off the page. It's a number you'd need to be looking for to see.
That's the part of tailings monitoring that doesn't get talked about much at conferences, where the conversation tends to live in failure modes and factors of safety. The actual failure mode, in a lot of these slow-building cases, isn't geotechnical ignorance. It's a measurement gap dressed up as a schedule. Quarterly walkdowns are quarterly because that's what the budget and the staffing and the helicopter availability allow, not because the dam's behavior politely waits ninety days between doing anything interesting.
A pond migrating toward an embankment is rarely dramatic in any single week. It's a few metres of beach lost to a wet month, a decant structure that's been drawing down slower than design because of a pump issue nobody escalated, maybe a berm raise that shifted the pool geometry just enough that the freeboard everyone's been quoting from memory is now wrong by a figure nobody's recalculated. Each of those, on its own, is a Tuesday. Stacked across ten or twelve weeks without anyone laying one measurement against the last, they add up to a pond sitting a lot closer to the embankment crest than the design basis assumed, with reduced beach width doing exactly what reduced beach width does to seepage gradients underneath it.
The engineer who eventually catches it usually catches it the honest way: pulling two sets of site photos for an unrelated reason, maybe a regulator request or an insurer's annual review, and noticing the pond edge sits in a different place in the two shots. At that point the conversation shifts from "is there a problem" to "how long has there been a problem," which is a much worse conversation to be having, because now someone has to explain a gap instead of explaining a trend.
The frustrating thing is that none of this requires a breakthrough in instrumentation. Piezometers and survey monuments do their job. The gap is temporal, not technical: the interval between site visits is long enough that a beach can narrow, a seepage stain can darken, and a crest can settle a few centimetres, and the first person to notice any of it is reading last quarter's numbers against this quarter's, three months after the fact, from a helicopter that got rescheduled twice.
Catching the three metres doesn't need a better instrument. It needs a weekly look, logged the same way every time, against the same baseline, so that "31 m" shows up next to "34 m" within days instead of within a quarter, catching the delta while it's still a delta and not yet a trend line heading somewhere unpleasant. Tailings Dam Monitor was built around exactly that gap: a weekly read on beach width, freeboard, seepage staining and crest movement, flagged against your own facility's baseline, pulled from imagery you don't have to schedule a flight for.
None of this is a case for abandoning the walkdown. A person standing on the crest with a level and a thermal camera will always see things a weekly image pass won't. But the walkdown was never designed to be the only thing watching the pond between visits, and for a long time it's been doing that job anyway, by default, because nothing else was logging the weeks in between.
If your own log has a gap like that sitting in it somewhere, it's worth asking what filled the silence before you noticed. Get in touch and see what a weekly log entry for your facility would look like.