Blog·
How to measure beach width from satellite imagery at a tailings facility
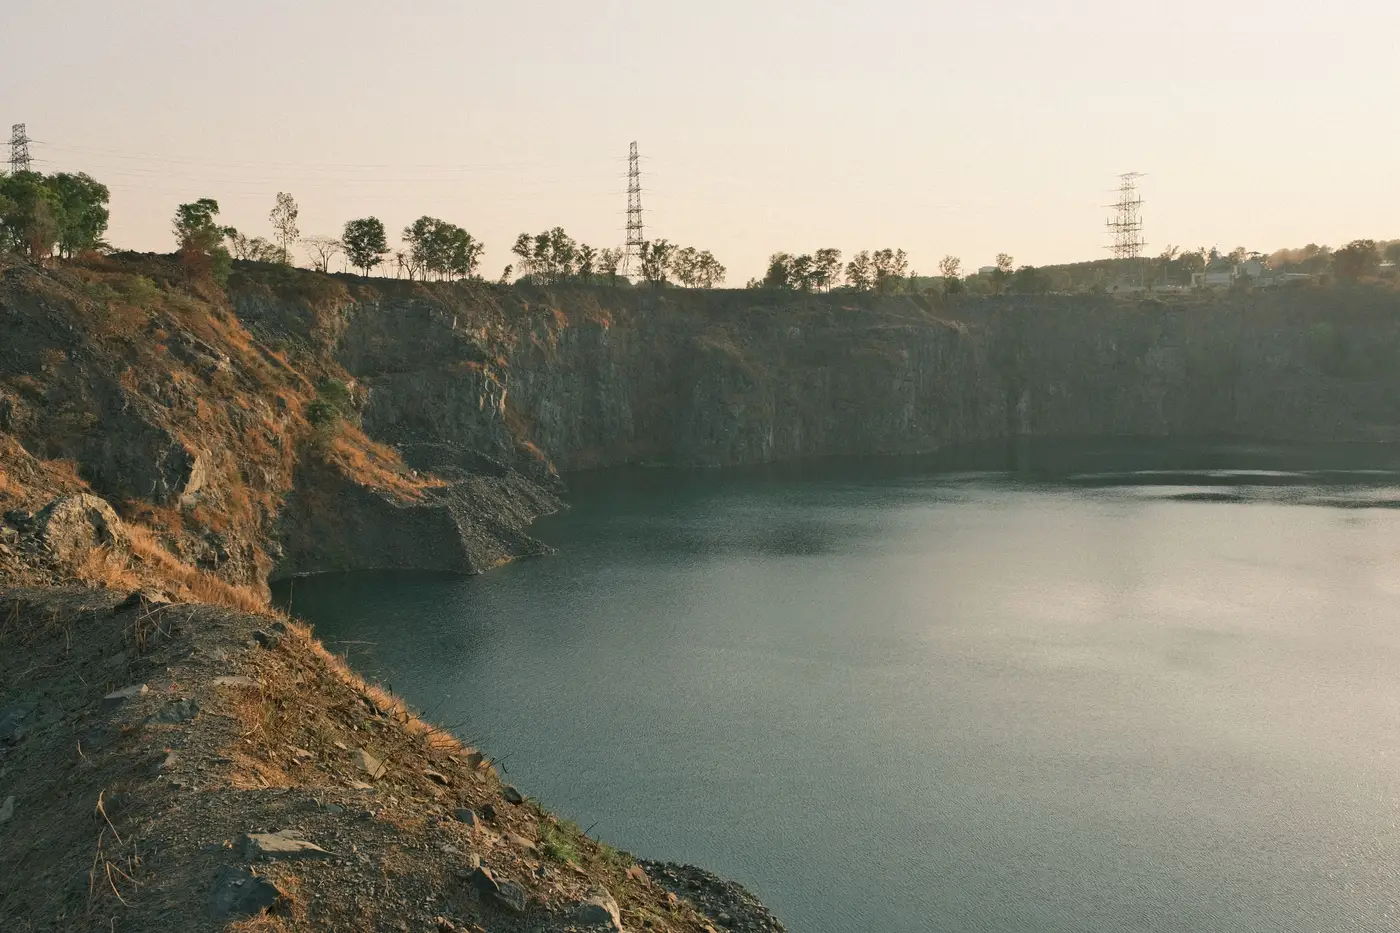
Beach width is one of those numbers that sounds simple on a drawing and gets argued about in the field. It's the distance from the edge of the supernatant pond (or the wet tailings line, depending on how your facility defines it) back to the crest or the upstream toe of the embankment. A wide beach means solids are depositing where they should and the pond is staying off the dam. A narrowing beach, especially one that's shrinking faster than your deposition plan predicted, is usually the first visible sign that something upstream, your spigot sequencing, your water balance, your discharge rate, needs a second look.
The old way to get this number is a walkdown with a rangefinder or RTK GPS, done quarterly, maybe monthly if the facility is on a tighter watch. That works, but it means the number is current for one day and then goes stale for weeks or months. A lot can happen to a beach in that gap.
What the imagery actually has to resolve
To measure beach width from overhead imagery, you need two things to show up clearly and separately: the waterline (or wet-tailings boundary) and a fixed reference point on the embankment, usually the crest centerline or a benchmark you've already surveyed in. On imagery coarser than about a meter per pixel, that waterline gets mushy, especially under flat light or with a thin surface sheen that doesn't contrast against saturated tailings. At 0.5 m ground sample distance or better, the edge is a line you can trace, not a guess.
Once you have that edge traced, beach width measurement is mostly geometry: you draw perpendicular transects from the waterline back to your reference line at a handful of stations along the beach (not just one point, since beach width varies a lot across a facility's perimeter), and you track how those transect lengths move week to week against the baseline you set when the facility was in a known-good state.
Optical imagery alone gets you most of the way there. Where it falls short is when the pond edge is hard to distinguish from damp but exposed tailings right at the waterline, the zone that matters most because that's where a beach starts to disappear. A thermal pass on the same overpass helps here: saturated tailings and open water read differently in thermal than dry beach does, even when the visible-light contrast is weak. Thermal adds a second signal on top of the optical read, catching the cases where optical alone leaves the edge ambiguous.
Where satellite measurement runs into limits
Cloud cover is the obvious one. A weekly cadence gives you more shots at a clean pass than a quarterly flyover does, but a facility in a persistently overcast region will still have gaps some weeks. Vegetation encroachment on an inactive beach can also confuse the waterline trace if the imagery isn't recent enough to reflect it. And satellite or aerial imagery tells you where the edge is, not why it moved. If beach width drops ten meters in a week, you still need someone who knows the discharge schedule to say whether that's a planned deposition shift or a problem.
What imagery does solve is the blind spot between walkdowns. A beach can narrow for six weeks before the next scheduled inspection catches it, and by then the engineer of record is asking questions you can't answer with "it looked fine last quarter." Measuring beach width on the same weekly cycle as freeboard, crest movement and seepage staining means you catch the trend early, before it shows up as a finding in someone else's report.
Tailings Dam Monitor runs that weekly read on all four indicators against your own facility's baseline, with the imagery behind every log entry, so you can see the beach measurement on the same cadence as the other three signals instead of waiting for the next walkdown to tell you what already happened. If closing that gap sounds useful for your facility, that's exactly what it's built for.