Blog·
How to read a dam safety inspection report before your quarterly walkdown
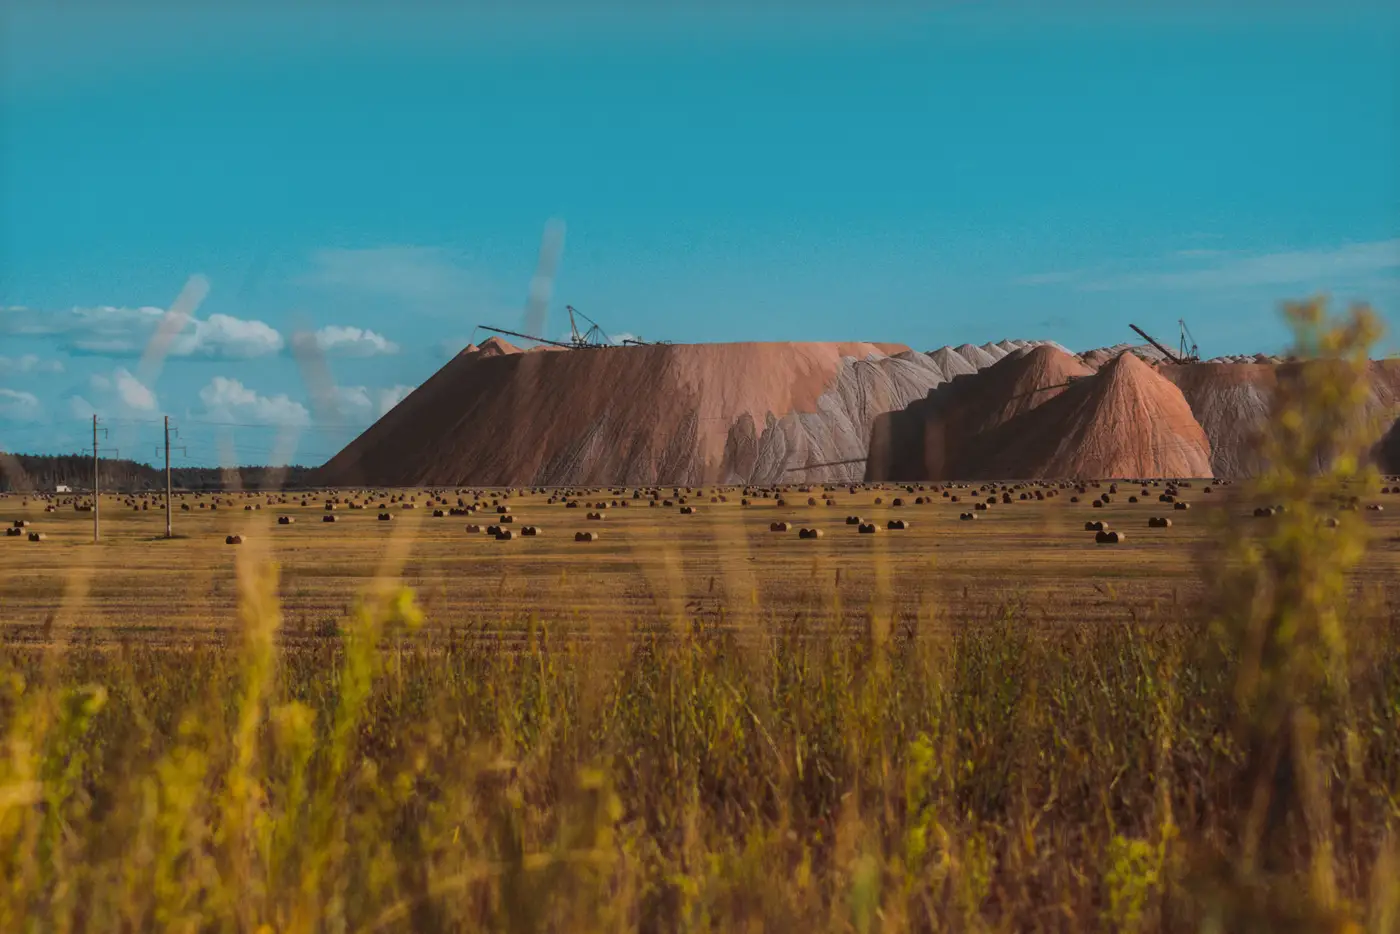
The engineer of record's report lands in your inbox, forty-some pages with a transmittal letter on top, and you've got maybe an hour before you're back out on the embankment. Most of that report is boilerplate: scope, methodology, a description of the facility you could write yourself. The part that matters to your next walkdown is usually three or four pages long. Here's where to find it and what to do with it.
Start with the findings table, not the narrative
Every DSR or annual inspection report has a findings or observations table somewhere, usually in an appendix. That table is the whole report compressed. Each row gives you a location, a description, a priority or risk ranking, and a status: new, ongoing, resolved, or recurring.
Read that table before you read anything else. The narrative sections exist to justify the table, not the other way around. If a finding is marked "recurring" or "ongoing" for the third report in a row, that's your walkdown priority regardless of how calmly the narrative describes it. Engineers tend to write measured prose even about things that worry them. The status column doesn't have that problem.
Pull every open finding into your own tracking sheet with the location tagged against your facility's reference points, whatever system you use for that, benches, stations, chainage. You want to be able to stand at a spot on the crest and know within thirty seconds whether there's an open item there.
Match findings to the four things you'll actually check
Most quarterly walkdown findings cluster around the same four indicators, no matter which engineering firm wrote the report:
- Beach width: has it narrowed since last report, and where
- Freeboard: any note on reduced freeboard, pond elevation trending toward design limits
- Seepage: new staining, turbid or increased flow at toe drains, any wet spots not on the prior seepage map
- Crest movement: survey monument deltas, cracking, settlement noted in the instrumentation summary
If the report includes a piezometer or survey data appendix, cross-reference it against these four before you walk out. A phreatic surface that's crept up two feet since last quarter is worth knowing before you're standing on the crest, not something you want to discover by noticing a new damp patch and wondering if it's related.
Build a one-page checklist from this: each of the four indicators, the last reported baseline value or condition, and the specific locations flagged in the findings table. That's what you bring out with you instead of the full report.
Where the gap actually hurts you
Here's the uncomfortable part. The report you're reading was probably written off an inspection that happened six to twelve weeks before it reached you. And your next walkdown is itself a point-in-time check, good for the day you're out there and silent on everything that happens between visits. A slow seep, a beach that's narrowing a few meters a month, a piezometer trend that's gradual rather than sudden: all of those can develop and keep developing in the gap between a quarterly walkdown and the one before it, with nobody watching in between.
That gap is exactly the problem a weekly read on the same four indicators is built to close, flagged against your own baseline so you're not starting from zero every time a new report lands.
What to bring to the walkdown itself
Print or load the findings table, your four-indicator checklist with locations, and the most recent instrumentation chart if one exists. Skip the appendices on methodology and regulatory framework. You already know the regulatory framework; you're the one complying with it. The report's job was to tell you what to look at and where. Once you know that, the rest of the document has done its work.
If you manage the dam safety file for more than one facility, keep the format of your checklist identical across all of them. The report formats from different EORs rarely match, but your walkdown routine shouldn't have to change with the letterhead.
Checking the same four indicators weekly, between the reports that land on your desk, is what Tailings Dam Monitor does.